
We talked about introduction to machine learning here.
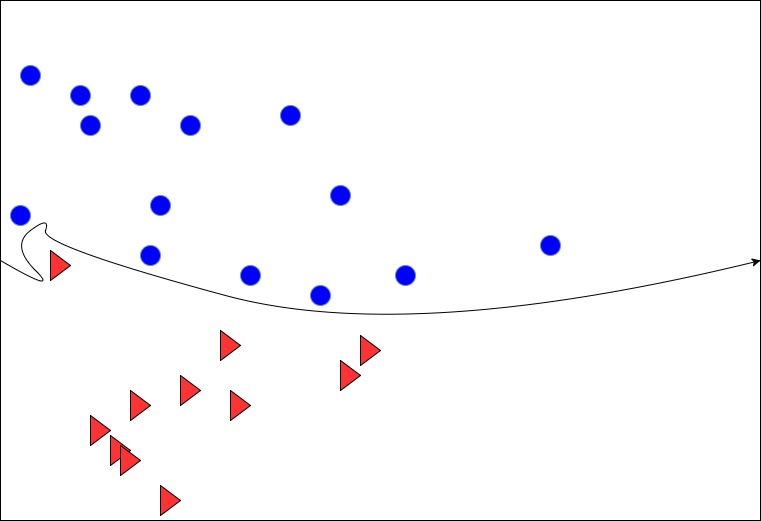
Let’s say, we have two armies: red and blue. The black line is the border separating these two armies. The line is curved and it is drawn using visual inspection. But the kings are mad and they demand a straight line, not a curved one. To please the king, let’s write the equation of a straight line:
y = mx + c
As per the equation, we’ll get different lines for different m and c values. Let’s visualise the different lines.
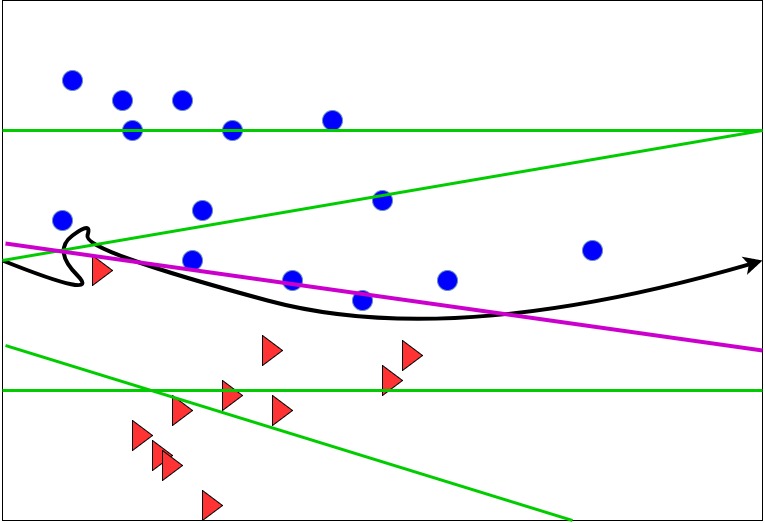
Straight Lines to separate the dataset
Green and pink lines are different outcomes of the above equation. Although we would like to have a line that completely divides the armies, we can live with an approximate line too. Here, we can see that the pink line approximately divides the blue and red army and can serve the fancy of the king as well.
In the machine learning terminology, the black curves line is the target function f(x), the pink and the green lines are various hypothesis functions h(x) . Hypothesis functions are basically a bucket of various equations that try to approach or best fit the f(x). The pink line is the best fit for f(x) and hence we say that it is our final hypothesis function g(x).
This can be better explained by a flow chart below:
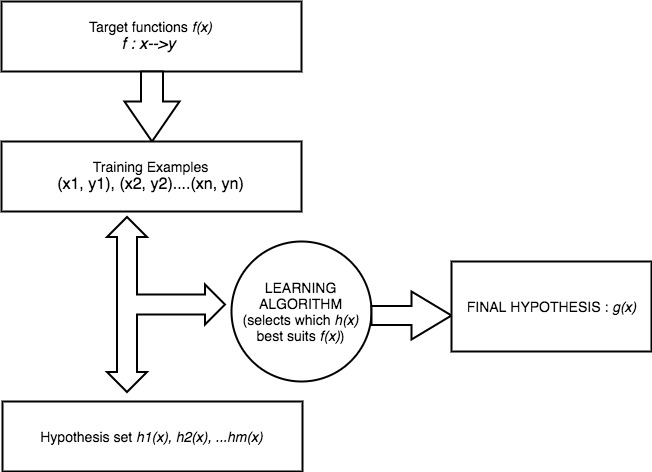
Referring to the flowchart above:
f(x) is the black curved line. Training Examples are the triangles and circles. Hypothesis set is the collection of green and pink lines. Final hypothesis is the pink line.
Okay. So, we have understood all the parts of the flowchart except for the learning algorithm. How come we decided that pink line is the best among all the straight lines?
There are many learning algorithms: Decision Tree, SVM , Perceptron among others. We are going to focus on perceptron in this post.
Let’s suppose for the sake of argument that each soldier of both army has following characteristics:
a. Strength
b. Accuracy
c. Speed
We can call these characteristics as X where x1 = strength, x2 = accuracy and x3 = speed. Each soldier is then described by a particular value of x1, x2 and x3. The kings agreed to have some weights associated with each characteristic: w1 for Strength(x1), w2 for Accuracy(x2) and w3 for speed(x3). Each solider is now given a score based on the formula:
score = (w1 * x1) +(w2 * x2) + (w3 * x3)
Now, if the soldier has score more than a threshold, he will belong to blue army else he is in red army.
For blue army:
score > threshold
For red army:
score < threshold
We can generalise the result as:
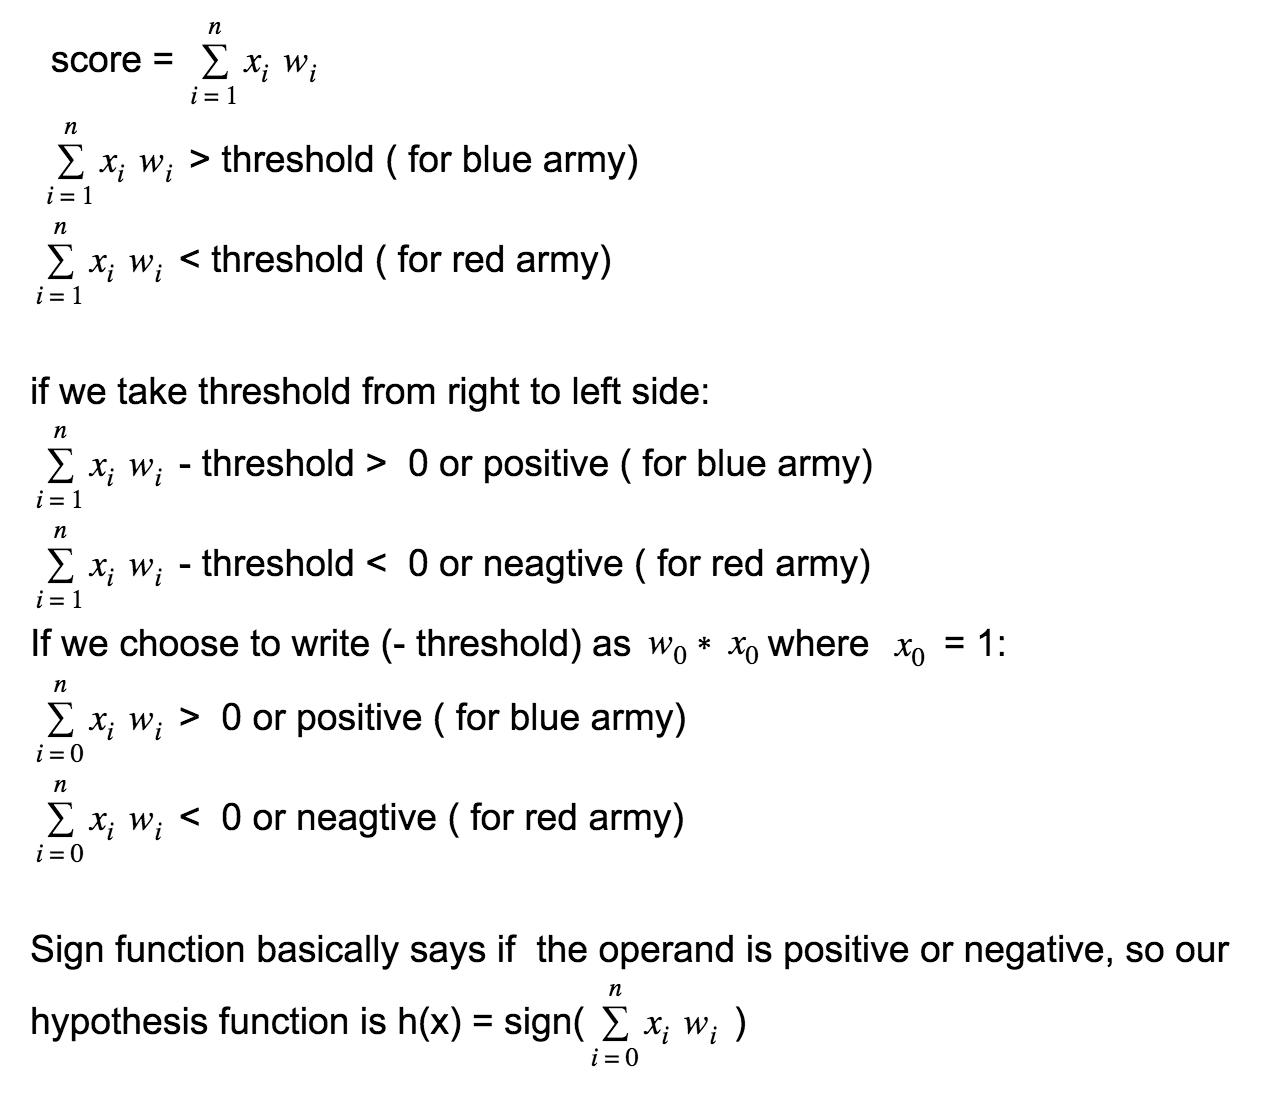
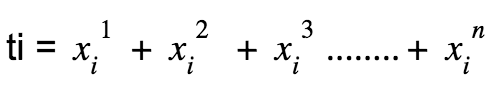
The perceptron implements h(x) defined above. Given a training set [(t1, y1), (t2, y2),(t3, y3), (t4, y4)……………(tn, yn)] which is linearly separable where:
Perceptron learning algorithm picks a point(tm, ym) where it misclassified. As in, our algorithm says ym to be positive where as in reality, it is negative. In such scenario, our learning model will update the weight as w = w + tm * ym.
The learning model will start yet another iteration until it is able to find the perfect division for the dataset. To make the visualisation, the perceptron learning model will find green lines and will continue until it is able to find a pink line.
If the data set is not linearly separable, perceptron learning algorithm will not converge and will continue until explicitly told to stop by limiting the number of iteration.
Read next post in the series here:
Further reading:
A Beginner Tutorial For ML Decision Tree Model Using Scikit And Panda
If you liked this article and would like one such blog to land in your inbox every week, consider subscribing to our newsletter: https://skillcaptain.substack.com
